Project FLOW
Future Leaders of Our Watersheds.
Local questions. Custom tools. Real data. Student leadership. Healthier watersheds.
Project FLOW engages students as practicing watershed scientists. It is a chapter-based environmental education and community monitoring program offered through DANalytics Environmental, which provides the configurable platform, chapter onboarding, data tools, and technical support a school needs to collect data that actually means something.
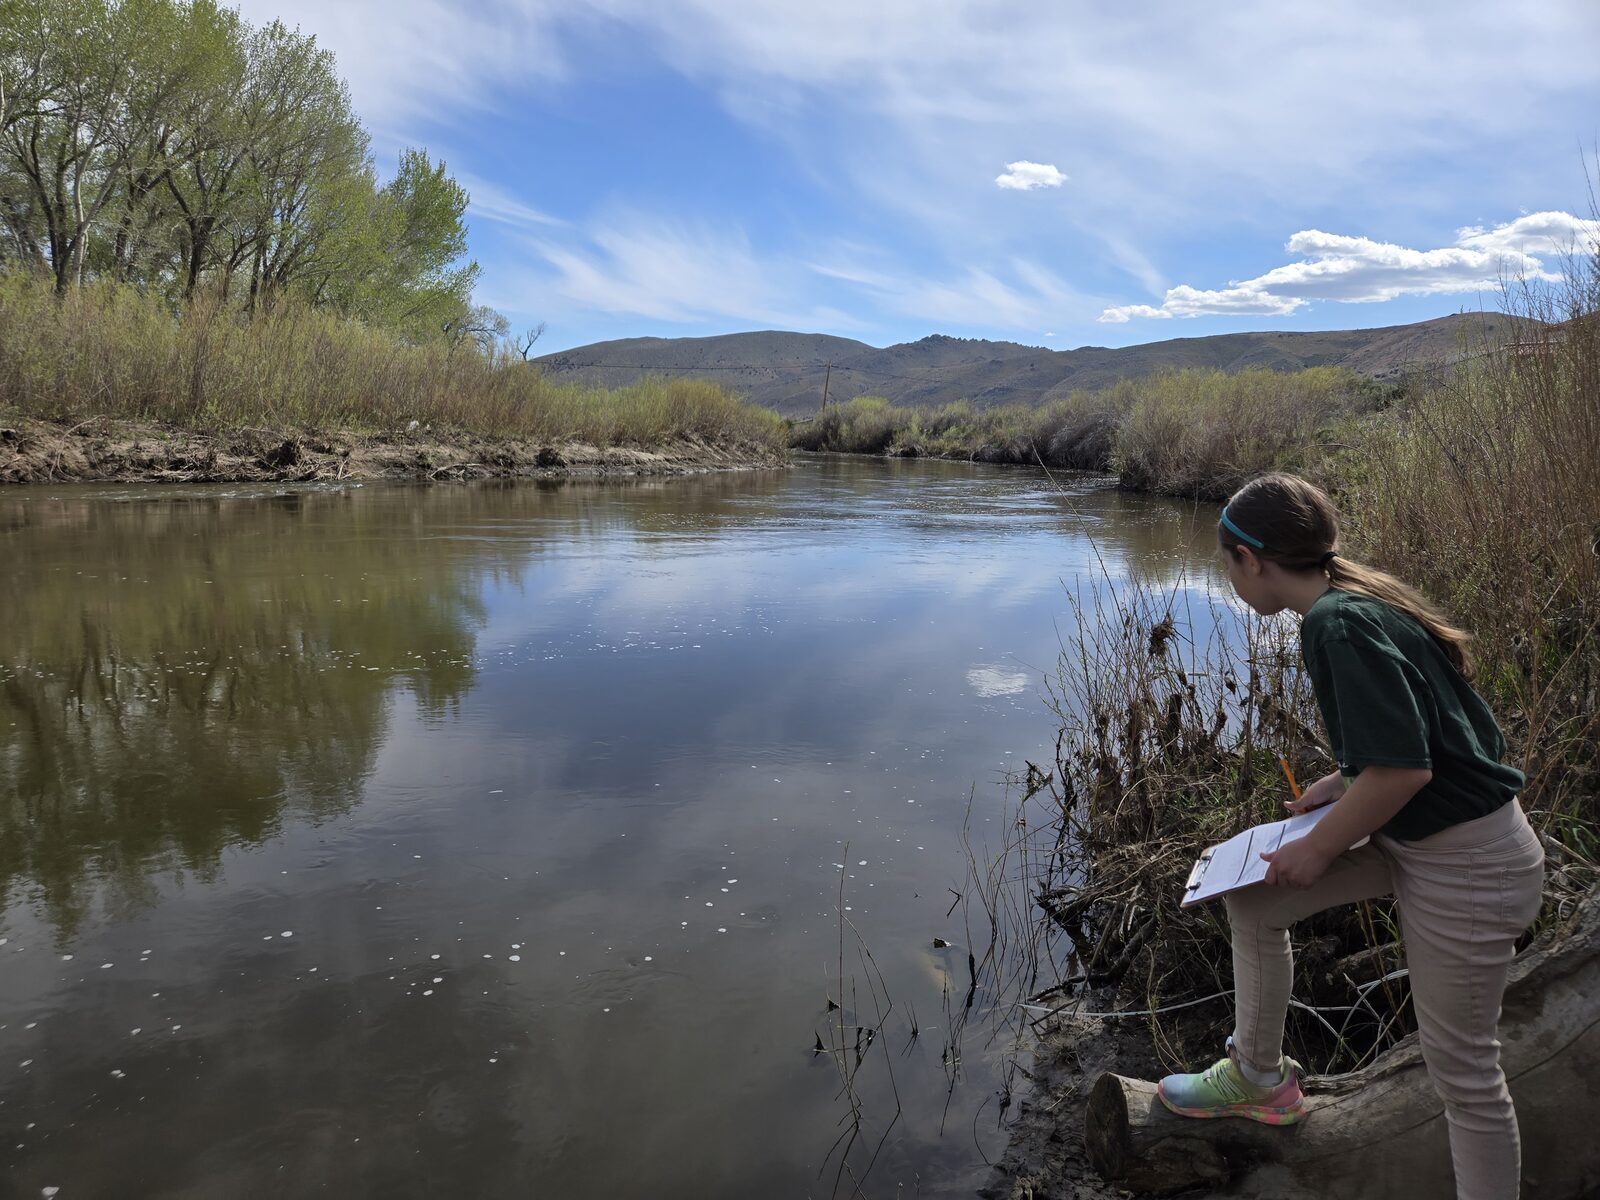
Most science education asks students to consume science. Project FLOW asks them to do it.
The three branches
One shared framework, three branches. Each brings something different, and a chapter only works when all three are present.
| Branch | Role | Brings |
|---|---|---|
| DANalytics Environmental | Software and program branch | A customizable digital platform, chapter onboarding, data-management tools, dashboards, and technical support for growth. |
| The local chapter | Education and place branch | Students, local questions, chapter leadership, field investigations, and communication that connects the work to the community. |
| Partners | Expertise and community branch | Scientific expertise, training and protocols, site access, resource support, and real-world context for how the data gets used. |
DANalytics makes the program customizable and scalable. Local chapters and partners make it meaningful. Every chapter is designed around the needs of its own students, watershed, community, and partner organizations.
That division is deliberate, and it is the honest description of what we do and do not provide. We build and run the software. We do not run your program, and we are not the ones who make it matter locally.
The founding chapter, on the Carson
Eagle Valley Middle School in Carson City, Nevada is the founding demonstration chapter. Students monitor the Carson River along the riparian corridor at Riverview Park, on public land managed by Carson City Parks, Recreation and Open Space.
The chapter is led by Amy Riddle, Project FLOW Chapter Lead and EVMS science educator — who is also married to the environmental scientist who writes the software. Project FLOW began as a conversation between the two of them at their kitchen table, and got as far as it did because a Rotary club, a state agency, a watershed nonprofit, a parks department, and a middle school principal all said yes. How it started →
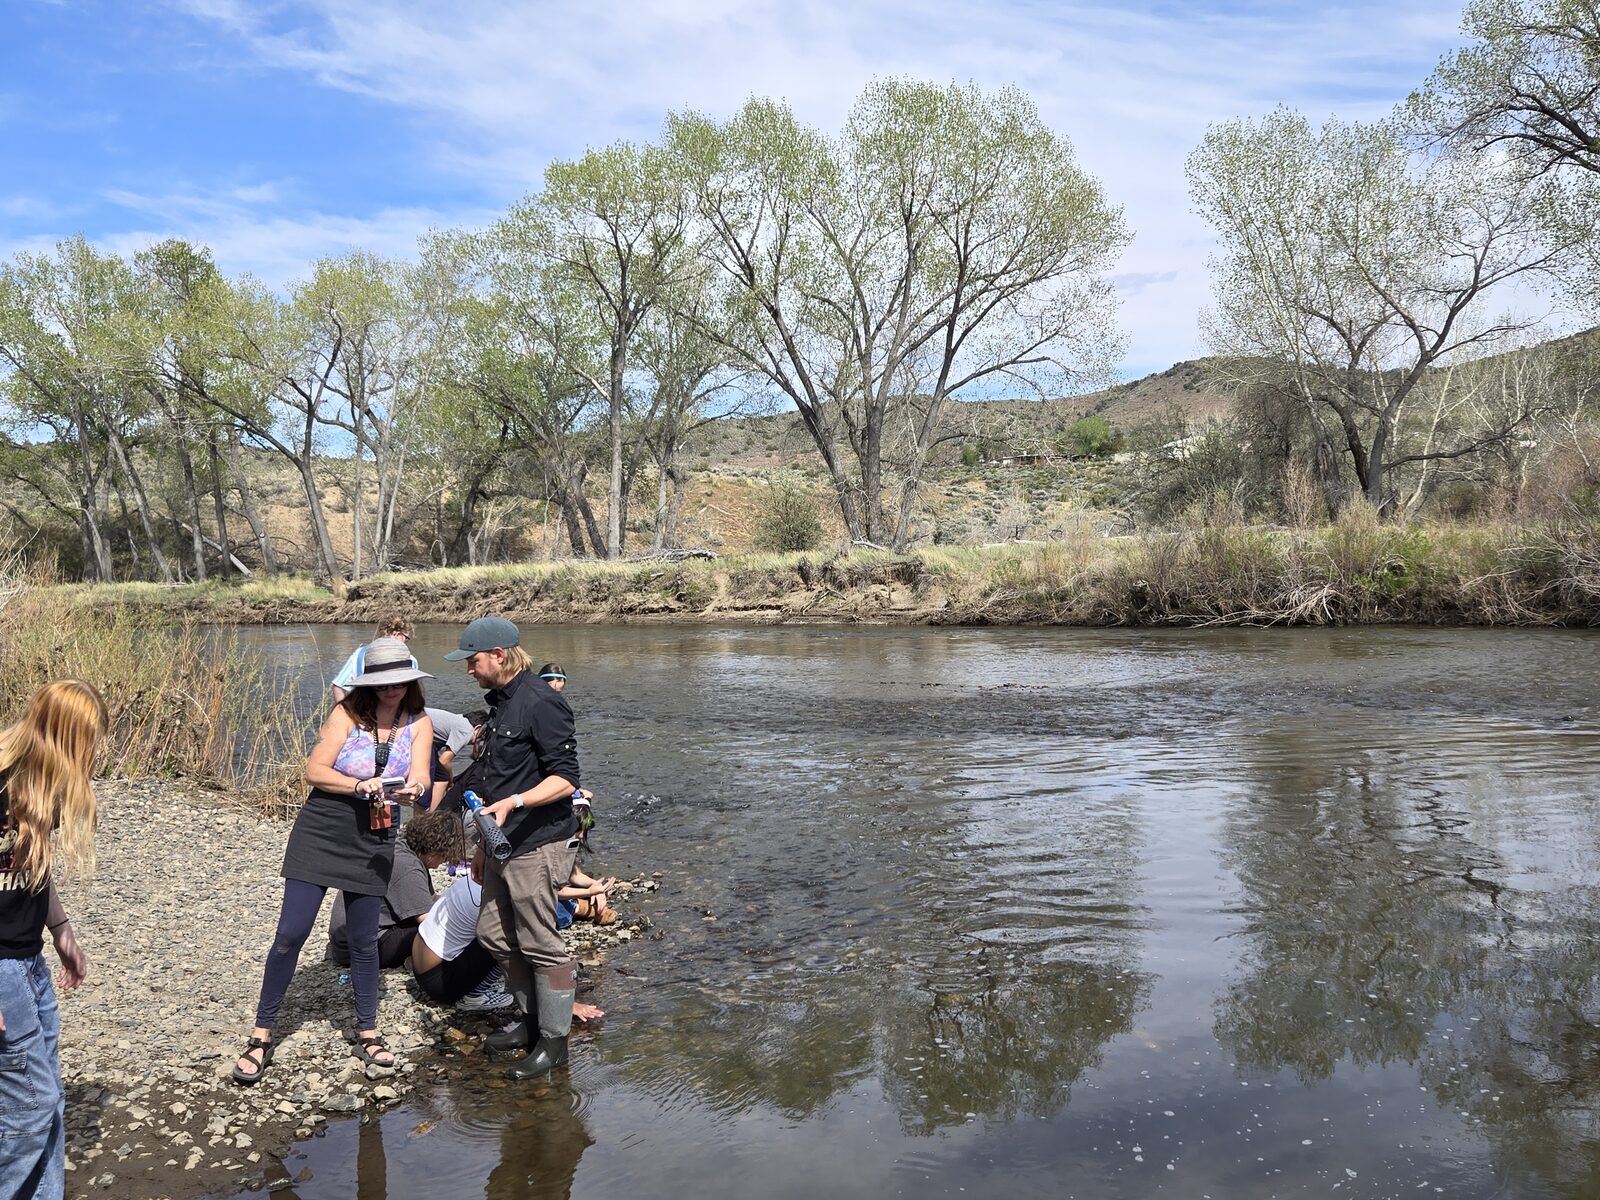
Launch day on the Carson River — Eagle Valley Middle School students and Project FLOW staff placing monitoring equipment, April 30, 2026.
EVMS is not a pilot in the sense of a trial run. It is the chapter that finds the problems first, so the schools that follow inherit the answers rather than the problems.
The chapter began with water temperature, specific conductance, and dissolved oxygen. The Rotary Club of Carson City provided $5,000 for the original continuous monitoring equipment. The Nevada Division of Environmental Protection contributed technical guidance and donated a continuous temperature logger.
Then, in summer 2026, the field equipment was stolen before any data could be retrieved.
What happened next is the more useful part of the story. Partners stepped in. Carson City Parks, Recreation and Open Space came to the table on site design and a permanent interpretive sign. Students moved to discrete field measurements one to two times per month, walking to the river to collect water temperature, specific conductance, and dissolved oxygen by hand — a design that is cheaper, harder to steal, and, as it turns out, better at teaching where a number actually comes from.
The chapter continued rather than stopping. That is a real example of scientific problem-solving, and it is strengthening the model that future chapters will inherit.
A program with one piece of equipment has a single point of failure. A program with six partners has a community.
Where the chapter is today
EVMS is not starting from zero. The founding chapter already has educator leadership, student programs, monitoring experience, equipment, learning spaces, software, and established community relationships.
- Continuous water temperature monitoring is running, on the logger NDEP donated. One original HOBO sonde remains available for discrete deployments.
- Discrete sampling continues one to two times per month while a safer permanent or semi-permanent installation is designed. The primary continuous-monitoring gap is specific conductance.
- The campus hoop house, native-plant work, Exploring Agriculture, and Green Biz Kidz connect water, habitat, restoration, sustainable agriculture, and student leadership to each other.
- DANalytics has contributed technical planning, data structure, software development, and the EVMS-specific field forms and dashboards.
The next phase is to turn these pieces into a durable founding chapter: finalize secure field infrastructure, restore continuous specific-conductance capability, establish consistent student monitoring teams and quality-control routines, complete the EVMS dashboard, expand public communication, and document a model other schools can adopt.
See it live — the public demo
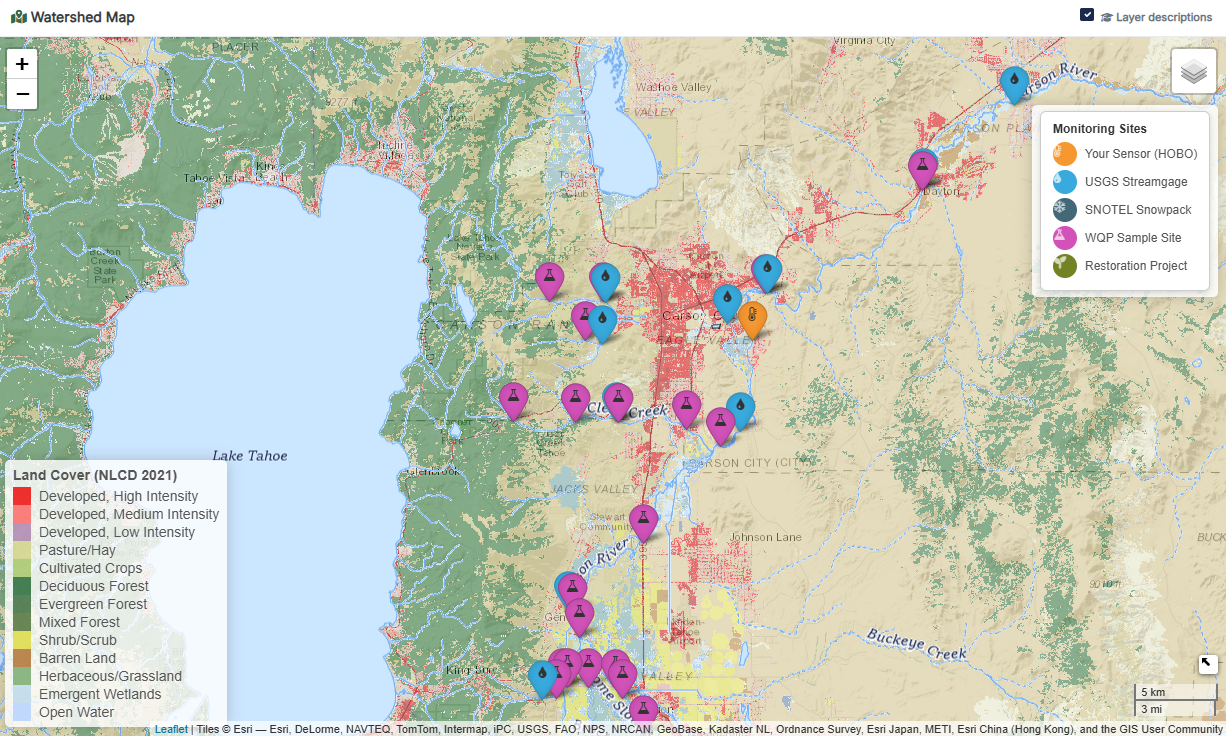
The Project FLOW app for Eagle Valley Middle School is publicly accessible. It runs the real teaching workflow on real student data from the Carson River — not a mock dataset — and it is the fastest way to see what a chapter actually does. Below: the Project FLOW watershed map, showing the Eagle Valley site alongside the network of USGS streamgages, SNOTEL snowpack stations, and Water Quality Portal sample sites that students can compare their data against.
Open the live Project FLOW demo →
The app architecture, parameter dictionary, water quality criteria, and EduStream narratives are fully active in the demo. Data accumulates as students collect it.
What a funded chapter gets is not this. The public demo runs on shared hosting, which is the right place to show the software and the wrong place to run a school year on. A chapter deployment is provisioned properly: a dedicated Linux environment, containerized so your configuration is reproducible and upgrades cannot break you, and a PostgreSQL database behind it — durable storage, real backups, referential integrity across years of records, and query performance that holds up as a chapter accumulates seasons of data.
That distinction is the difference between seeing the workflow and owning it. The demo shows you what students do. The chapter deployment is the one that still has your data in it four cohorts from now.
What a chapter receives
Each chapter receives a configurable program environment rather than a one-size-fits-all package. We work with the chapter lead and partners to shape the tools around the chapter’s watershed, equipment, questions, and intended audience.
| Chapter profile and sites | Chapter identity, monitoring locations, site details, and partner information. |
| Digital field forms | Forms configured for your students, educators, volunteers, and approved partner data entry. |
| Custom parameter menus | Your parameters, units, sampling schedules, field observations, and approved additions over time. |
| Dashboards and graphs | Current readings, historical trends, seasonal comparisons, and student-friendly visualizations of your water. |
| Data access and exports | Secure storage, user permissions, downloadable datasets, reports, and presentation-ready outputs. |
| Onboarding and support | Chapter setup, launch guidance, technical assistance, software improvements, and room to expand. |
What the local chapter lead does
The chapter lead is the other half of this, and the half that determines whether it works:
- Serves as the primary contact for DANalytics and for local partners
- Coordinates student participation, scheduling, permissions, transportation, and site logistics
- Ensures participants follow agreed-upon safety, calibration, quality-control, and monitoring procedures
- Maintains chapter equipment and keeps records complete, accurate, and clearly documented
- Communicates with partners and helps students share findings with community audiences
Customizable by design
Each chapter begins with a focused set of measurements and can request additional parameters, observation categories, forms, or reporting tools as it grows. Configuration follows the chapter’s educational goals, equipment, research questions, safety considerations, and partner recommendations.
Water quality — temperature, specific conductance, dissolved oxygen, pH, turbidity, nutrients, or other approved chemistry.
Watershed conditions — water level or flow, weather, air temperature, precipitation, site and habitat observations, and soil or riparian conditions.
Stewardship and learning — macroinvertebrates, biodiversity records, restoration activity, cleanup data, student reflections, photos, and maps.
A chapter does not need to monitor every parameter or stay inside a fixed menu. We can configure additional measurements, observation categories, forms, and reporting tools when they support the chapter’s questions, equipment, and partner-approved methods.
The platform is the same everywhere. The river is not.
Data quality and responsible use
Project FLOW supports educational, community science, outreach, planning, and exploratory monitoring.
When data will be used for regulatory decisions, formal research, or public compliance reporting, the chapter works with the appropriate agency or scientific partner to establish approved protocols, calibration, quality assurance, and data review. DANalytics manages the technical system. We do not turn educational data into regulatory data.
The platform clearly identifies the source, date, method, units, equipment, and review status of every dataset, so anyone using the information understands how it was collected and how it can appropriately be applied. That is what makes student work trustworthy — not a claim that it is something it isn’t.
Data access and ownership. Chapters retain access to their submitted data and work with us to set user permissions and decide what information, if any, appears publicly.
What makes Project FLOW different
Real data, not classroom data
Most K–12 water curricula give students cleaned, pre-packaged datasets to “analyze.” Project FLOW does the opposite. Students work with raw sensor records — the same files a hydrologic technician would receive — including drift, fouling, and gaps. They learn what specific conductance is by looking at their own specific conductance data. They learn what a fouling correction is by applying one to their own sensor record.
Built to professional standards
Project FLOW shares its data infrastructure with CEDAR, the DANalytics analytics engine. The quality control algorithms, audit trails, citation engine, and parameter dictionary are designed to agency standards, and student observations are recorded in the DANalytics water quality schema — a structured record format built so that one chapter’s data can be compared against another’s, and against public data for the same watershed.
The rigor lives in the software architecture rather than in the user’s expertise level. A seventh grader and a hydrologic technician get the same audit trail.
Honest about what the data does not say
Field measurements taken at midday, twice a month, are a real dataset and a specific one. They cannot resolve the daily temperature cycle, and they miss the pre-dawn oxygen minimum that actually stresses fish. Project FLOW says so, on the chart. Students learn that knowing the limits of a measurement is part of making it.
Locally owned, technically supported
The EVMS chapter reflects the Carson River, its students, and the priorities of Carson City. We provide a common digital structure without forcing a fixed project on anyone.
The curriculum is the software
Most educational tools teach science with the lesson on top and the instrument underneath — a worksheet wrapped around a calculator. Project FLOW is built the other way around. The teaching lives inside the engineering. Nearly every design decision in the app is also a lesson, and most of them stay invisible until a student trips over one in the middle of real work, which is the only time a lesson actually sticks.
That layer is built by a scientist and a teacher who happen to be married to each other.
The science — quality control algorithms, correction methods, water quality criteria, the data schema — comes from Daniel Riddle, an environmental scientist with almost two decades in rivers. The teaching — how a lesson is timed, how a twelve-year-old is met where they are, how a data anomaly becomes a discussion instead of a worksheet — comes from Amy Riddle, a credentialed science educator working with her own students, against her own standards, in the founding chapter’s own classroom.
Most educational science software is built by someone who has one of those two disciplines and rents the other. Here they eat dinner together. A lesson gets written, meets thirty sixth graders the next morning, and gets a verdict that night — which is a shorter path from built to actually tested on children than any amount of process buys.
The lessons ship inside the platform, so a chapter does not have to build them.
A few of the ones hiding in plain sight:
-
Two classes, one dataset. Every class period cleans the same raw record independently, and then the app compares them. When one period keeps a reading another threw out, students discover — from their own hands, not a textbook — that environmental data is interpreted, not merely measured. Two careful people can look at the same number and disagree. The question stops being “who is right?” and becomes “whose reasoning is more defensible?” — which is the question working scientists actually argue about.
-
Correct first, then check. The app applies sensor fouling and drift corrections before it runs automated quality control — deliberately, and not the way most tools do it. That ordering is a lesson in disguise: it separates systematic error (a slowly fouling probe that biases every reading) from random error (a genuine, sudden anomaly). Correct the bias first, and the anomaly detector is finally free to flag what it was built to find.
-
Flag it, never delete it. Students don’t erase suspicious data. They flag it, attach a note explaining why, and the original reading is preserved permanently. That single rule teaches provenance, reproducibility, and intellectual honesty at once: a record without its history is not a record.
-
A number you can feel. 22.5 °C means nothing to a seventh grader — until the app mentions it is about the temperature of a warm bath, and also the point where trout begin to stress. Abstract units become physical intuition, without a definition in sight.
-
The river follows the air, but slower. Two temperature loggers — one in the water, one in the air above it — plotted together show the water lagging and softening the air’s daily swings. That one picture is why riparian shade matters, and students read it in their own data instead of a diagram.
-
The watershed is a system. A student’s reading appears alongside USGS streamflow, SNOTEL snowpack, and climate data for the same watershed and the same week. Snowmelt drives flow; flow drives temperature; temperature drives oxygen; oxygen drives what can live there. Students measure one link and learn to see the whole chain.
EduStream
Those lessons are delivered by EduStream, a narrative engine that surfaces science when the data — or the season — calls for it: a temperature exceedance, a snowmelt cascade, a dissolved oxygen anomaly. Twenty-four context-triggered cards ship with the app, graded from beginner to advanced, and the per-parameter science behind them is drawn from EPA educational materials.
None of it arrives as a quiz. Cards appear when the data does something interesting, in the middle of the work — which is exactly where a lesson has a chance of lasting.
Chapters remain free to author and own their own instructional materials. Lesson plans, teacher guides, assessments, and standards crosswalks belong to the educators who write them. What ships with the platform is the in-app teaching layer, included with a chapter at no additional cost.
Teachers make the platform better, and every chapter gets it
A teacher who has actually run a lesson knows things about it that the person who wrote it cannot. When a card lands wrong. When a field form asks for things in an order that falls apart with thirty students and a clipboard. When a chart is technically correct and useless at the front of a classroom.
Tell us, and we change it. That is a large part of what annual service is for.
Within your chapter, that means configuration: your parameters, forms, thresholds, dashboards, user roles, and which teaching cards surface and when. If your class needs a card to hit a different standard, or your site needs a threshold that reflects your river rather than ours, that is an adjustment, not a custom build.
Across chapters, it means something better. There is one engine and one codebase. An improvement made because a sixth-grade teacher in Carson City said a lesson was confusing is an improvement every chapter receives on the same day. The platform gets sharper every year that a classroom uses it, and no chapter pays twice for the same fix.
That is also the honest limit of it. We tune the software and the teaching content inside it, with your educators telling us what is wrong. We do not write your curriculum, and we do not claim what your educators create.
The student experience
Students take on real roles. Depending on grade level and chapter design, they may prepare equipment, visit monitoring sites, enter observations, examine graphs, compare seasons, investigate unusual readings, interview experts, build public displays, or explain findings to families and community leaders.
| Role | What it looks like |
|---|---|
| Field scientists | Prepare equipment, follow safety procedures, collect measurements, document conditions. |
| Data analysts | Use dashboards to graph temperature, conductance, and dissolved oxygen, compare seasons, and connect their record to other publicly available data. |
| Communicators | Write explanations, design displays, create presentations, share findings with the public. |
| Watershed ambassadors | Represent the chapter, welcome partners, lead younger students, connect stewardship to community needs. |
| Problem solvers | Respond when equipment, schedules, weather, or field conditions do not go as planned. |
| Future professionals | Explore careers in environmental science, software, GIS, engineering, agriculture, and public service. |
Concretely, over a season students collect field measurements on a regular schedule; deploy, service, and download continuous loggers; import their own records through the app; apply automated QC checks and review flagged readings; correct sensor drift and fouling using documented agency methods; compare their measurements against USGS streamflow, snowpack, and climate data for the same watershed; export clean, fully cited datasets; and generate a Hydrologic Report Card for their site.
The Hydrologic Report Card
At the end of each school year, Project FLOW generates a Hydrologic Report Card — a parameterized scientific document telling the story of the class’s year in data. Parameters are compared against applicable water quality criteria. Seasonal patterns are summarized. Weather and snowmelt events are connected to river response. Field visits are documented with photos. Every QC decision the class made is preserved, and every data source and method is cited.
It is a real scientific deliverable — the kind a watershed group would produce — and it is meant to be printed and sent home with the student at the end of the year.
Inside it sits a Data Quality Report Card: a grade on the record itself. How much data survived, how often the students and the automated checks agreed, and how little the cleaning actually moved the answer. Students who have waded into a river take critique of that record personally, which is precisely the point. Learning to hear a finding about your own data without flinching is a professional skill, and thirteen is a good age to start.
How chapters grow
Chapters do not have to start big. A school can begin at whatever level of complexity fits and grow into something larger as it earns its place.
| Model | What it looks like | Best for |
|---|---|---|
| Classroom | One teacher, one site, a limited parameter set, a short investigation tied to curriculum. | Teachers launching place-based science or data literacy projects. |
| School | Multiple classes or grades share a site, a student leadership team, a dashboard, and annual outreach goals. | Schools building a sustained environmental program. |
| Network | Several school chapters use shared methods and compare sites across a watershed. | District science initiatives, CTE pathways, cross-school collaboration. |
| Community hub | A school chapter hosts public events, partner training, displays, and community science. | Schools near a waterway, park, restoration site, or public facility. |
Connections to teaching and learning
The work reaches across a school rather than sitting inside one course:
- Earth and environmental science — watersheds, water cycling, ecosystems, climate, human impacts
- Mathematics — measurement, units, averages, rates, graphing, trend analysis, comparison
- Technology and computer science — sensors, databases, dashboards, digital mapping, software design
- Career and technical education — agriculture, natural resources, GIS, engineering, data science, public service
- English language arts — technical writing, evidence-based claims, interviews, reports, presentations
- Civics and leadership — community needs, public lands, agency roles, stewardship decisions, youth voice
A chapter’s data can serve several grades at increasing technical depth, so a student can meet the same river three years running and have a harder question about it each time. How that maps onto a school’s scope and sequence is the chapter’s call — its educators know their standards, and we do not write curriculum for them.
Beyond water
A watershed is not only its chemistry. Working with Carson City Parks, Recreation and Open Space, the EVMS chapter is hoping to expand into the habitat that surrounds the reach — wildlife observation, bird surveys, riparian vegetation and cottonwood condition, streambank erosion, repeat photo-monitoring points, and native plant propagation in the school’s hoop house for future restoration work.
The scientific thread is the same one the water data follows. Water temperature governs dissolved oxygen; dissolved oxygen governs what can live there; the vegetation on the bank governs the water temperature. Students measure one part of a system and learn to see the rest of it.
Habitat observations are recorded as configured chapter parameters today — counts, conditions, and dated photo points entered through the same forms and the same audit trail as the water data. Structured camera trap imagery review is on the platform roadmap under WILLOW, and is not a shipping capability. We say so plainly for the same reason we publish the module status table: a chapter should know exactly which parts of its program the software carries and which parts it does not, before it buys.
Green Biz Kidz, the school’s after-school stewardship team, is already the official steward group for the trail nearest the school — which makes the habitat they monitor the same habitat they care for.
How partners can participate
Partnership and financial support are related, but they are not the same thing. Public agencies, watershed groups, parks departments, nonprofits, universities, businesses, service organizations, and community funders can participate in whichever role fits their mission.
| Role | What it involves |
|---|---|
| Technical advisor | Help select parameters, establish methods, review equipment needs, train educators and students, interpret results. |
| Site partner | Provide safe access to waterways, parks, restoration areas, public lands, or facilities where monitoring can occur. |
| Chapter sponsor | Support equipment, software configuration, transportation, protective infrastructure, or chapter coordination. |
| Data and outreach partner | Use student-friendly summaries, maps, observations, or trend displays in public education and outreach. |
| Regional coordinator | Connect several chapters, identify shared watershed questions, organize sampling periods or annual events. |
| Career connection | Introduce students to scientists, technicians, developers, land managers, engineers, and public-sector careers. |
Students gain authentic audiences, expert guidance, and career connections. Partners gain a long-term education pathway, stronger community understanding, student-created outreach, and locally grounded observations that complement their own work.
What a chapter typically needs
Beyond the software, a launching chapter is usually looking for some combination of: monitoring gear, calibration supplies, student safety kits, and secure field infrastructure; coordination time and educator and student training; safe ongoing access to a river, park, or facility; help getting student data and stories in front of the community; and the flexibility to try an approach, learn from what does not work, and adjust the following season.
Partners
The EVMS chapter is supported by Eagle Valley Middle School and the Carson City School District, the Nevada Division of Environmental Protection, the Carson Water Subconservancy District, River Wranglers, Carson City Parks, Recreation and Open Space, the Rotary Club of Carson City, and DANalytics Environmental.
That list is the point. A school chapter works when the community around it has a reason to care.
What success looks like
A strong chapter is not defined by how many sensors it owns or how many data points it collects. It is defined by the quality of student learning, the strength of community partnerships, the consistency of the work, and the value created for the watershed.
- Number and diversity of students participating in fieldwork, analysis, and leadership
- Student growth in watershed knowledge, scientific practice, data interpretation, and communication
- Consistency and quality of monitoring records over time
- Usefulness of dashboards, reports, and observations to partner organizations and the community
- Number and strength of school–community–agency partnerships
- Public presentations, displays, community events, and stewardship actions completed
- Expansion to new sites, new chapters, or new student leadership roles
Student data
Project FLOW does not need to know who your students are. Work is identified by class period, team, or a chapter-assigned identifier — no names, no student IDs, no email addresses required by the schema. The environmental data a chapter collects belongs to the school district, is never sold or used to train anything, and becomes public only where the chapter deliberately publishes it. Full policy →
Bring Project FLOW to your school
Project FLOW is designed to be deployed at additional schools, with each chapter configured for the local waterbody, water quality criteria, monitoring parameters, and community context — no software changes required. The same platform supports youth monitoring programs run by watershed organizations and tribal environmental departments.
A new chapter does not start from a blank page. Every chapter that comes before it leaves behind configuration templates, field protocols, monitoring and maintenance procedures, safety documentation, and data entry forms. That is what makes this a network rather than a product: the second chapter is easier than the first, and the tenth is easier than the second, because each one inherits what the others learned.
Expansion stays mission-driven. Every new feature, parameter, or chapter should strengthen student learning and local watershed stewardship — multi-school networks comparing upstream and downstream sites, agency-supported studies on restoration or drought, public dashboards, student chapter officers and peer trainers, career pathways, and regional watershed days.
It started at Eagle Valley Middle School on the Carson River. With the right partners alongside us, that same model can travel to the next community after that.
To discuss bringing Project FLOW to your school or program, contact daniel@danalyticsenv.com.
Built on open data
WQP · USGS · NOAA · NASA POWER · ATTAINS · SNOTEL
- Posted on:
- July 22, 2026
- Length:
- 21 minute read, 4317 words
- See Also: