The Confluence
A confluence is where two streams meet and combine flow. It is also where the scattered records of a watershed can join into one picture.
The Confluence is where DANalytics publishes that picture, for anyone who lives near a river. Agencies, tribes, universities, and volunteers have measured the Carson, Truckee, and Walker rivers for sixty years. Their data sits in a dozen databases that no one outside the profession opens. The atlas gathers all of it into one map and makes it something a middle-schooler, a rancher, or a county commissioner can explore.
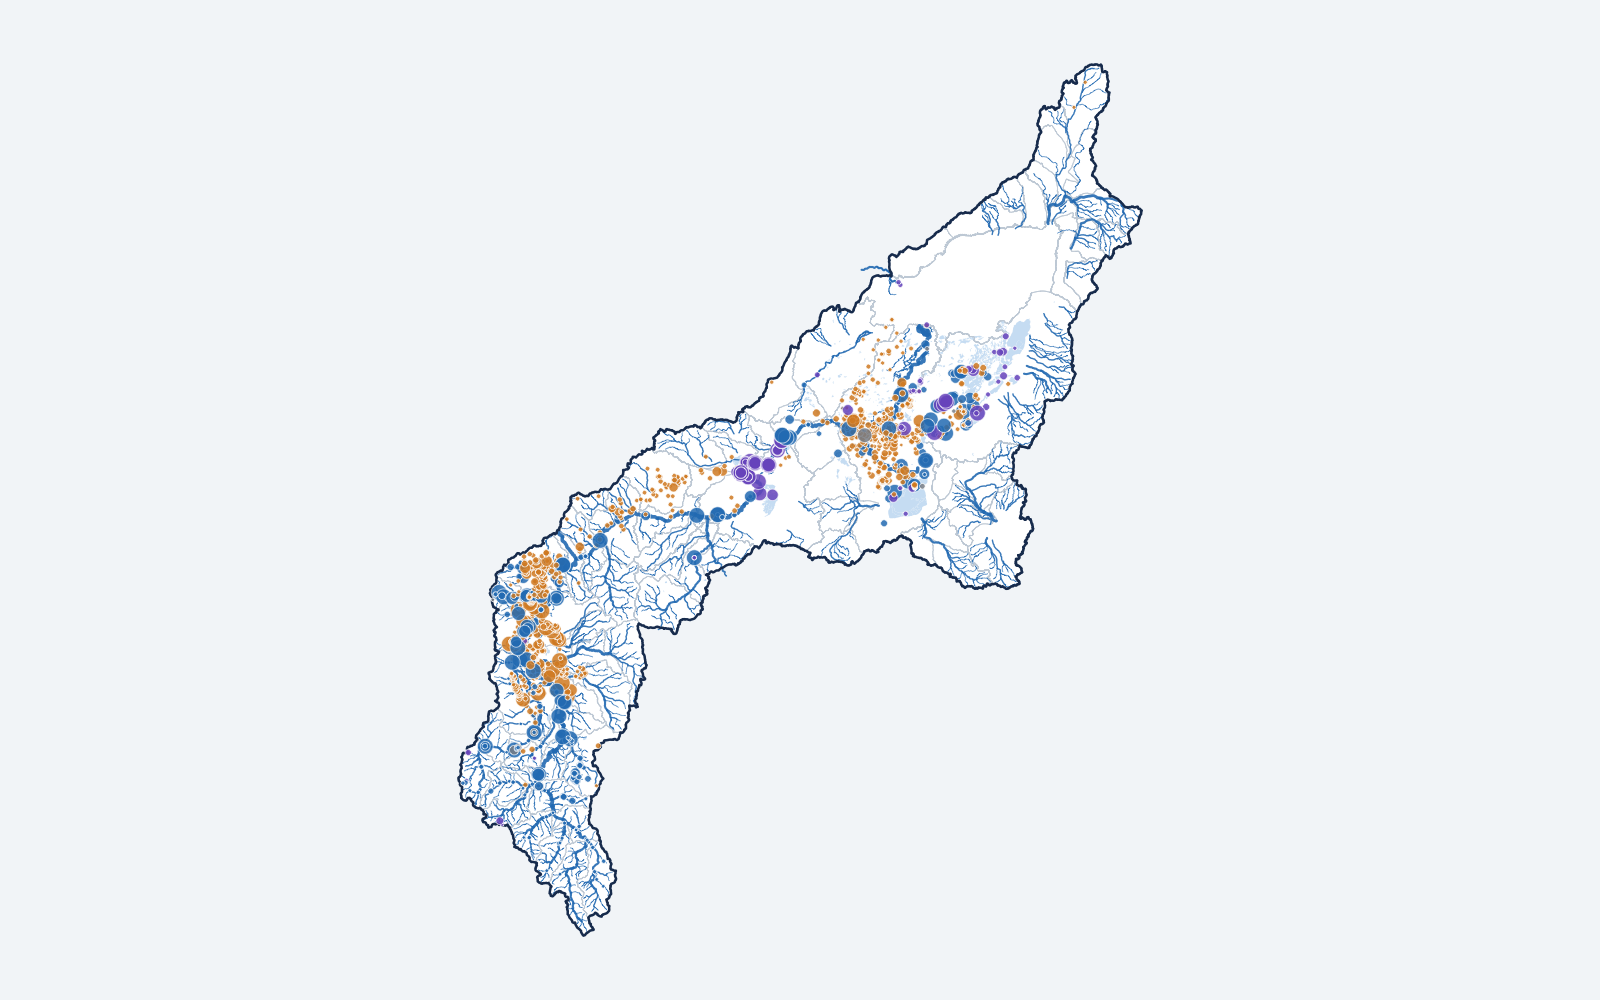
What you can do on the atlas
Start with a story. The Tamarack Fire, Leviathan Mine, the Comstock’s mercury, the restoration at River Fork Ranch. Each one is told with the data: sites downstream of the event against sites elsewhere, before and after, with the USGS publications behind it and plain-language summaries of what they found.
Watch the basin move. A whole water year in thirty seconds: snow building in the Sierra, then draining through every gauge. Or fly the river over real terrain from Carson Pass country to the Carson Sink.
Draw the river as a line. Every site from the headwaters to the sink on one axis, any measurement, any year, with a slider to move through time.
Look up a date. Your birthday, your wedding, the day you moved here. What was the river doing, how deep was the snow, how many people lived in the basin?
See what the river is doing right now. Streamflow at every gauge against normal for the date, Lahontan Reservoir storage, Lake Tahoe’s height above its rim, Walker Lake’s distance below its historic shoreline, snowpack and soil moisture at every SNOTEL site, weather alerts, fires, and drought, fetched live from the agencies that measure them.
Go as deep as you like. Every site opens to its record as measured, every sample, nondetects included, before any test is run. Ask for the trend test and it comes with its assumptions written out. Wells open to their water table through time. Pick any sites and plot them against each other. Trends are screened with the same statistics a state agency uses, and labeled as a starting point, not a finding. Subwatersheds color by population growth. Sites filter by what was being collected when.
How it stays honest
Every number traces to the agency that measured it. Every method is written down on the page that uses it. When a comparison has too few sites to mean anything, the atlas says so rather than showing a chart anyway. Summaries written for a general reader carry a caption saying how they were made and whether a person has reviewed them.
First the Carson, then the Truckee and the Walker, then yours
The Carson atlas came first, with its stories. The Truckee atlas, from Lake Tahoe to Pyramid Lake, followed from the same pipeline in one day: a configuration file, a data pull, and a build. The Walker, Sierra to Walker Lake, took the next day, and its dashboard shows the lake against the shoreline it held in 1882. Nothing in either is specific to its river except that file and the stories, which is the point. The same pipeline and the same page build an atlas for any watershed with a public record, and the Carson’s stories are the template for yours.
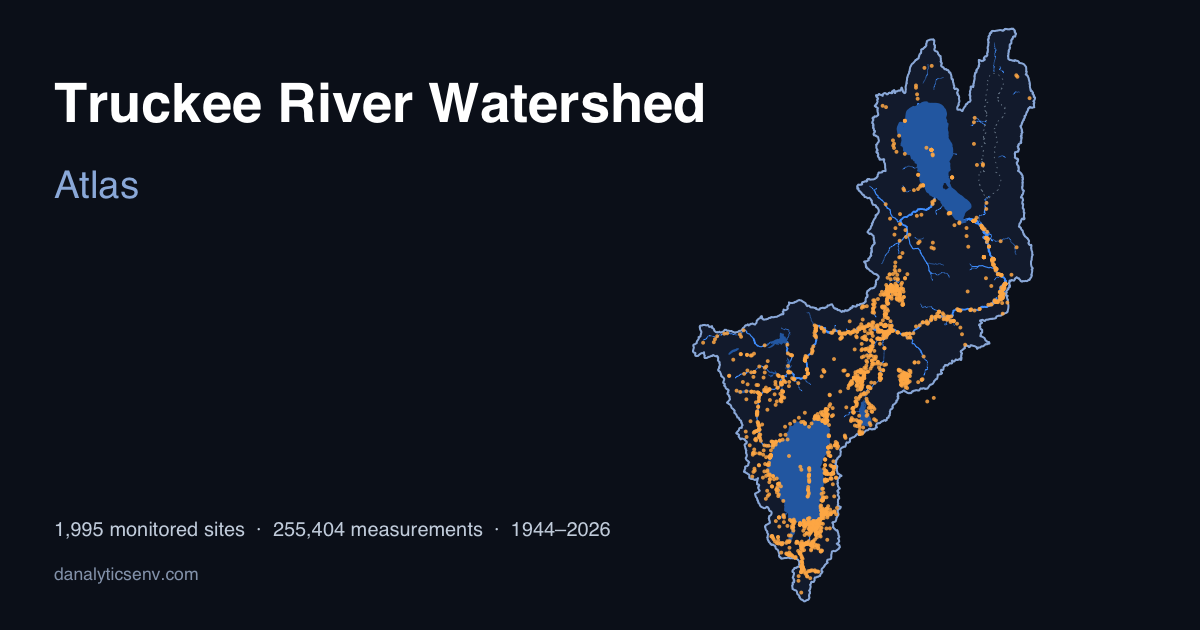
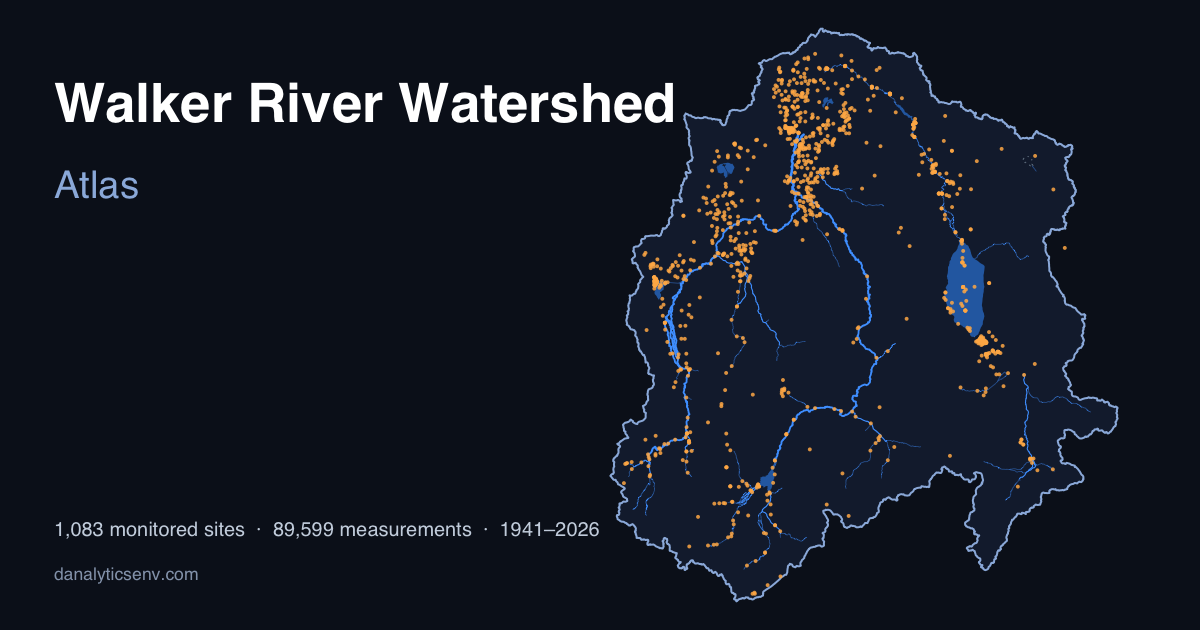
The Truckee and the Walker have no stories yet. If you know one that belongs there, each atlas has a form for it.
Community monitoring joins the same map. As Project FLOW chapters and community programs publish their data, their sites appear alongside the agency record, clearly marked, on the chapter’s decision.
Want one for your watershed? A public atlas, kept current every night, with the stories your community cares about, a live dashboard, and a scientist on call. How that works →
Do you have a Carson, Truckee, or Walker River story that belongs on the atlas? A restoration, a flood, a fish kill, a place that changed. Email Daniel and let’s get it on the map.
- Posted on:
- September 21, 2026
- Length:
- 4 minute read, 785 words
- See Also: